Controlling - Costs-Benefits-Analysis - Contribution Margins
Related questions:
- Which product line should be expanded?
- Which activity destroys value?
- Which branch contributes most to fixed costs?
Analysis:
It covers the past, including many years gone by.
What has happened, and what does it mean economically?
Controlling:
It concerns the present, the very recent past, and the very near future.
Where are we deviating, and what should we steer now?
Planning:
It is directed towards the future, it often covers several years.
Which development or alternative should we choose?
Controlling can be understood as a feedback system: results are compared with targets, deviations are identified, and corrective action is taken[1]:
[1] Source H . Wittmann. See http://finance.wiwi.tu-dresden.de/Wiki-fi/index.php/Controlling, Part „Grundkonzept des Controlling als kybernetisches System“, and http://www.docju.de/themen/controlling/handouts/regelkreise.pdf
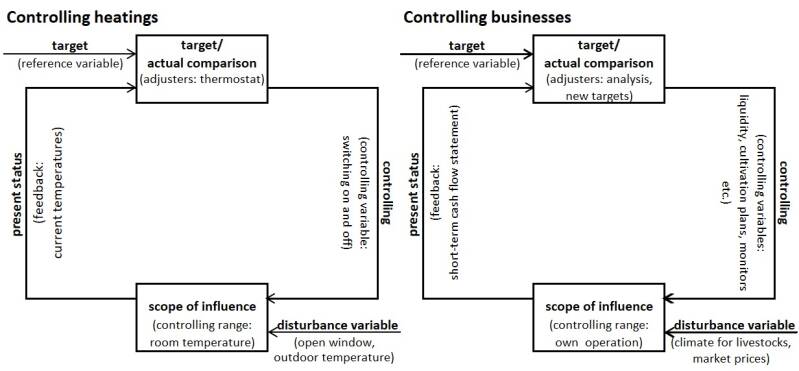
The diagram compares the controlling of a heating system with business controlling.
The activity of steering a company is often called ‘controlling’.” In production controlling, an increasing number of sensors can be used, there are short-term indicators. In relative speaking, it is difficult to identify suitable indicators for business management controlling. Yet, you can compare current sales with those from the same month a year ago to adjust your advertising strategy accordingly.
The terms “benefits” and “costs” are used in reference to a company's business branch (or to a production process). Intra-company turnover between business branches must be included.
Benefits = income according to accounting records
+ internal turnover generated
Costs = expenses according to accounting records
+ internal turnover consumed
Costs can be categorised as either variable or fixed.
- Variable costs are proportional to the volume of production.
- Fixed costs include e.g., depreciation and insurance expenses.
Overhead costs, e.g. interest and wage expenses, are sometimes listed separately but are often counted as fixed costs. The track is as follows :
Benefits → Variable Costs → Contribution Margin
Contribution Margin → Fixed Costs → (ordinary) Profit
Full costs are crucial for competitiveness. However, when making decisions, you should normally continue production as long as the contribution margin is positive. This is why stopping production does not reduce fixed costs.
The total contribution margin is used to cover fixed costs and generate profit.
The recommended sequence is:
- Calculate contribution margins: benefits − variable costs.
- Compare branches, products or services.
- Examine fixed costs and overheads.
- Determine full costs when competitiveness must be assessed.
It is advantageous to calculate the contribution margin in the same way for future developments as for the analysis. This allows you to compare current and planned contribution margins. Then the path to the future is obstacle-free.
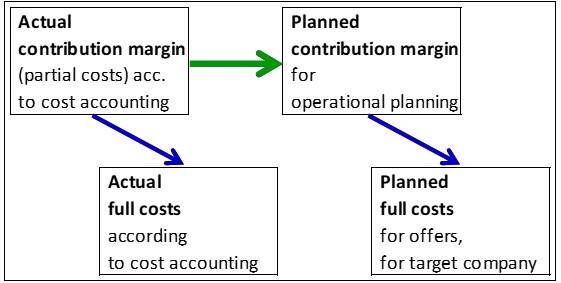
In an existing business, partial and full costs can be determined using a 'company allocation sheet'.
However, when preparing a business plan for a new company, there are no costs to allocate. Then, you should look for base numbers in industry-wide company comparisons or in data collections. You can then project the benefits and costs altogether in the form of a P&L statement.
When applying this second method to an existing company it is sometimes possible to obtain sufficiently accurate full cost data. This can be applied to agriculture, for example. If the cost of fertiliser per hectare of potatoes, etc., is known, the total fertiliser expenses for the entire farm can be extrapolated.
These projections can then be compared with the existing company's P&L statement. Perhaps, this method of cost-benefit projection could also be applied in your sector of the economy.
If so, it will save you a lot of time. Instead of spending several days with company allocation sheet, you may only need to spend several hours on extrapolations/projections.
The following diagram shows projections in JUP PS.
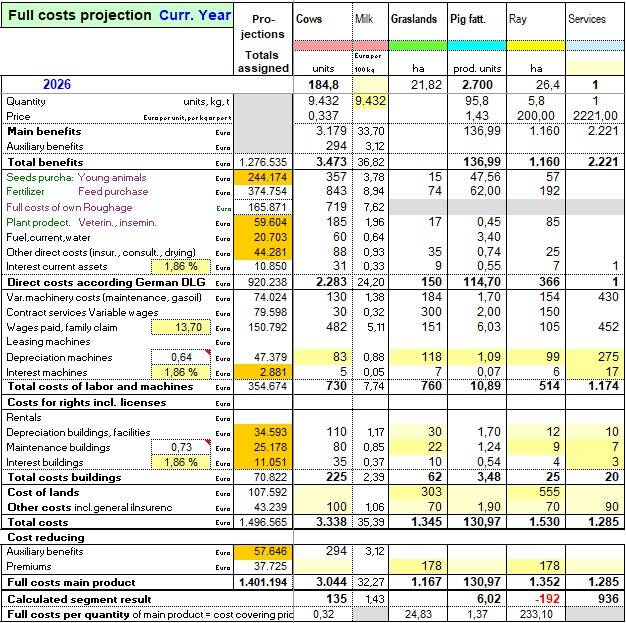
The sequence of costs often differs between cost systems. This is also the case in German agriculture. That can be seen in the following diagram.
There, in the contribution margin column, the variable costs of machinery appear as part of the variable costs (to be seen just before the contribution margin line).
However, in the full cost column, the variable costs of machinery are included in the cost of work performed. This full-cost system was invented for a cost comparison between using in-house machinery and own labour versus hiring contractors to perform field operations.
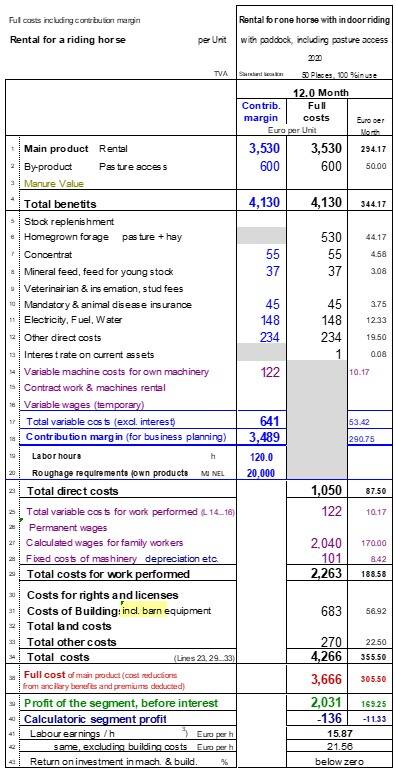
The following table shows a calculation for stable rentals for a riding horse. There, roughage is handled differently: it is shown in the contribution margin column in MJ NEL (units of nutrient required) and in the full-cost column in euros.
In the case of horse rental, you will not find entries in each position. For example, under 'veterinarian', you won't find a number. This is why such costs are paid directly by the horse's owner to the veterinarian.
This kind of double-column system makes the handling of costs in different classification schemes easy to explain.
This table with two cost columns - for two cost systems - can be adapted for other economic sectors.
If you are interested in these subjects, see the file