Liquidity: Explaining Cash flows
Business management literature is full of advice for entrepreneurs, for example on how to start a business. A wide range of terms can be found. However, the indicators whether the business runs or not, often take a back seat. Here are the three main terms and the questions associated with:
Profitability:
Are labour, capital and other resources adequately rewarded ?
Liquidity:
Is enough cash available throughout the year ?
Stability:
Is the existential basis strong enough to survive difficult periods ?
The file 'Business Management - Basics, Indicators, Examples.pdf' contains informations on profitability and stability.
Let's focus on liquidity !
This paper will focus solely on periodic liquidity, more exactly to the cash flows. A good understanding of cash flows can help to avoid liquidity problems and even bankruptcy.
Closest to accountancy : the Cash flows 1–3
Cash flows 1–3 relate directly to the four classes of double-entry bookkeeping, see page 'Accounting ...'. Out of all the cash flow systems, cash flows 1–3 are the cash flow system that most closely aligns with accountancy. Let's it explain first. In German speaking countries farmers are used to it more than 35 years.
- Profit accounts
→Gross cash surplus → Cash flow 1 - Private accounts
→Adjusted deposits / withdrawals → Cash flow 2 - Financial accounts
→ Sustainable repayments → Cash flow 3
- Tangible asset accounts
→ Depreciation as a benchmark of cash flow 3.
This scheme highlights the bridge from accounting to Cash flow 1-3.
Entrepreneurs may ask:
- How much cash the business generates from operations?
- How much remains after private deposits and withdrawals/dividends?
How much is left for investment after repayments of debts?
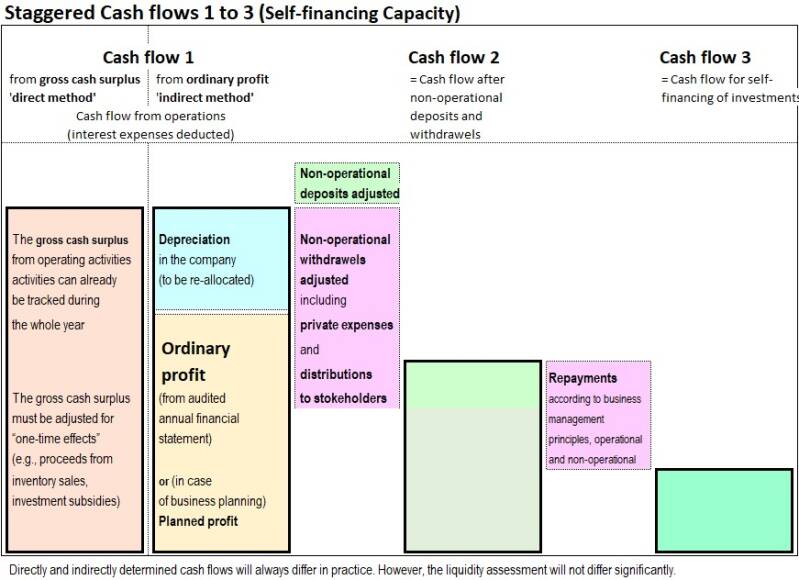
The following diagram shows the whole cascade of Cashflows 1-3.
Cash flow 1 — Operational cash flow
Two methods to get it:
-> Gross cash surplus from the profit accounts (direct method).
-> Ordinary profit + depreciation (indirect method, practitioner's formula).
Adjustments of Gross Cash Surplus for Cash flow 1
To obtain a sustainable operational cash flow, extraordinary items must be removed:
- one‑time payments (inheritance payments, land sales, accident compensations)
- non‑periodic receipts
- accidental events
- non‑operational items
This ensures that Cash flow 1 reflects normal business operations, without exceptional events.
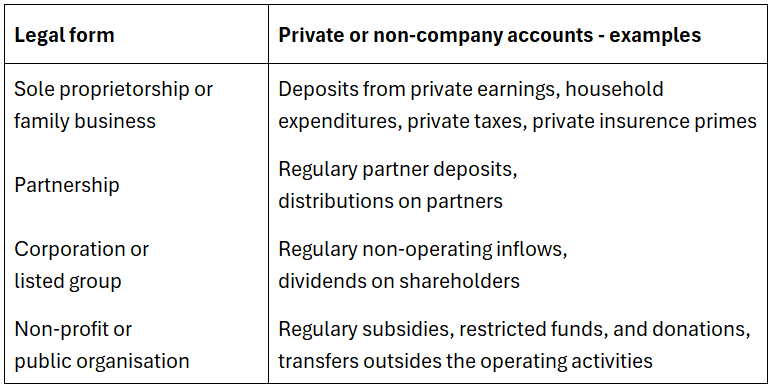
Cash flow 2 — Cash flow after adjusted deposits and withdrawals
Cash flow 2 starts with Cash flow 1 plus deposits minus adjusted withdrawals. Withdrawals and deposits do not arise from the analysed business activity.
Initially, all cash transactions to and from private savings accounts should be deducted from the total deposits and withdrawals figure.
In large companies, distributions to shareholders are regular withdrawals, despite their fluctuating amounts. Distributions are not available for investment within the company. You can also find deposits in big companies, such as from rented residential properties or photovoltaic panels, which do not belong to the analysed company. There are also organisations that regularly benefit from subsidies, e.g. from churches. Depending on the legal form, withdrawals and deposits are named differently.
Cash flow 3
= Self-financing capacity
= Cash flow for self‑financing of investments
Recorded repayments describe what happened during the period; adjusted repayments are used to assess what the business can sustainably bear.
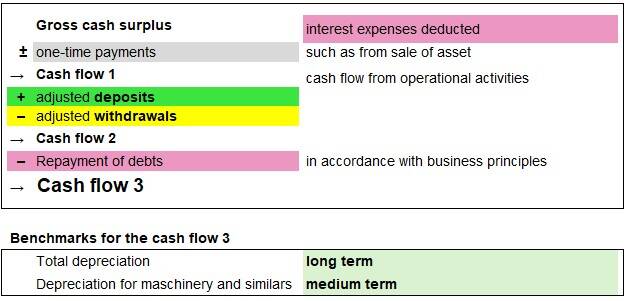
Cash flow 3 = Cash flow 2 — sustainable repayments
This step requires careful analysis:
- repayment deferrals
- unscheduled repayments
- debt restructuring
- fixed‑rate mortgages without repayments
- repayment suspensions
- refinancing effects
For more details, including those regarding the benchmarks, please refer to the 'Business Management - Basics, Indicators, Examples' PDF file.
Benchmark for Cash flow 3 — Depreciation as the Key Metric
You can compare Cash flow 3 with depreciation as a benchmark.
Long term benchmark: Total depreciation.
Medium term benchmark: Depreciation of machinery and perennial crops.
Buildings usually require no reinvestment for 15+ years.
In business planning and bank ratings, the long-term view is often too strong.
For analysis bear in mind:
→ If the company has deferred investments in recent years, the depreciation will be far too low.
→ Conversely, if the company has fully invested in new buildings, equipment and machinery, the reinvestment required in the medium term will be significantly lower than the ongoing depreciation. Therefore, the company will be able to make high repayments to banks.
Yet, cash flow 3 must be interpreted carefully under inflation. In countries with high inflation, reinvestment costs may be far above depreciation.
The 'debt service limits' are often measured by the utilisation of these limits. The two 'reinvestment coverage rates' (in %) reflect this:
→ Long-term Reinvestment Coverage Rate
= cash flow 3 / total depreciation
→ Medium-term Reinvestment Coverage Rate
= cash flow 3 / depreciation on machinery and assets with a similar service life
Comparison of Cash flow systems for analyses and planning
Caution! Many cash flow training offices have their own definitions!
Cash flow 1-3
The cash flow 3, measured against depreciation, is not just an "early warning system." It is also a simple teachable concept. For entrepreneurial liquidity analysis, you will realise that Cash flow 1–3 cascade more informative than any others cash-flow measures:
- respects the four account classes
- shows sustainable liquidity
- shows self‑financing capacity
- works for SMEs and large groups
- works for planning and analysis
- works internationally
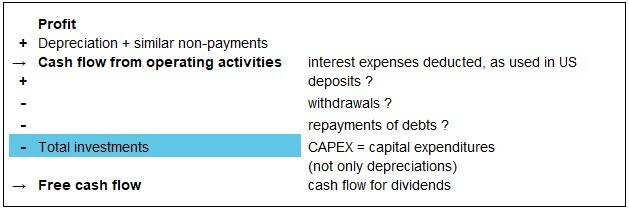
Free Cash flow
- ignores deposits and withdrawals
- starts from unadjusted profit
- can be misleading when investments fluctuate
- does not respect the four account classes
Consequences:
a) If investments are minor, the company can pay huge withdrawals such as dividends.
b) If investments are high, no or few dividends/withdrawals can be paid.
The crucial question is: Who actually makes decisions in this way?
Nevertheless, even groups like the German ZF apply it.
Retained Cash flow
- ignores non‑company deposits
- ignores private withdrawals beyond dividends
- uses profit instead of ordinary profit
- not compatible with double‑entry logic
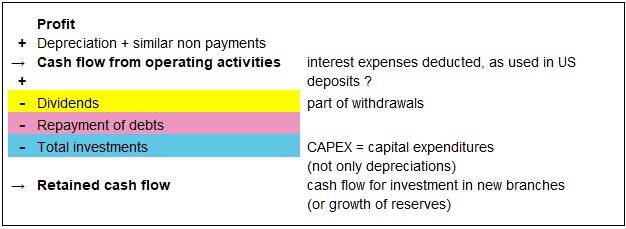
Retained cash flow indicates the amount of cash remaining after total investment in existing activities.
Debt Service Limits
- Long‑term version deducts total depreciation.
- Medium‑term version deducts machinery depreciation.
- Benchmark fully integrated.
- Developed by agricultural experts. It can be replaced by Cash flow 3.
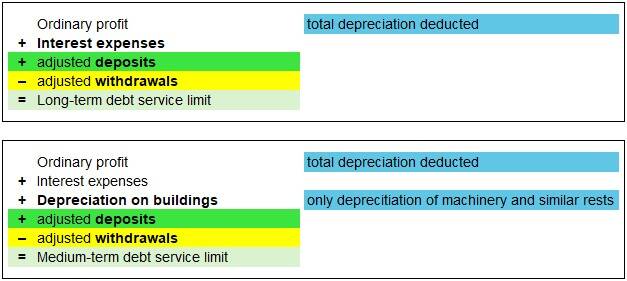
The question of ‘cash flow 3’ is:
Is there enough left for investments – after repayment? '
The question of 'debt service limits' is:
Is there enough left for the banks – after reinvestment (depreciation)?
As you can see, ‘Cash flow 3’ and its reference values, as well as the ‘debt service limits’, raise mirror-image questions.
The two decisive metrics are the same:
→ long term → the total depreciation
→ medium-term → the depreciation of machinery (and assets with a similar service life, such as perennial crops in agriculture).
The "utilisation of the debt service limit %" was often quoted as a relative indicator. Examples:
Debt service / medium-term debt service limit
Debt service / long-term debt service limit
The ‘reinvestment coverage rate’ for Cashflow 3 reflect these.
The cascade cash flow 1-3 can also be applied in business planning. But if you plan for a company, which faces big financial difficulties, see the section Short-term liquidity planning on the page of business planning.
Other terms which contain 'cash flow'
Discounted cash flow
Although the discounted cash flow is a useful concept, it can only be used for future calculations. It involves discounting the estimated cash flows for subsequent years to their present value using financial mathematics. Therefore, discounted cash flow is not a means of analysing annual financial statements. It is just for planning! It shows profitability more than liquidity.
Cash flow statement
The cash flow statement is the result of a completely different way of thinking. It is a three-layer model, not a cascade.
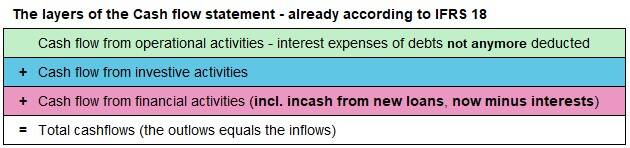
It is based on the 'capital flow calculation' (German: 'Kapitalflussrechnung'), which was not been widely accepted in business management, at least in Germany. For more details, see the section on BayWa and IFRS 18 below.
The totals of the cash flow statement answer the trivial question:
Do cash inflows, including inflows from new borrowing, equal cash outflows?
Without further analysis, a reader might draw the misleading conclusion that : As long as the company can obtain new loans, outflows will not be a problem.
Unfortunately, this is how most states operate. But companies cannot!
This is how the cash flow statement works according to IFRS 18 :
- mixes own funds with new debts,
- moves interest expenses out of operating activities,
- hides poor operating results, due to transfering interest expenses to financial activities,
- uses three “activities” that are not derived from the four account classes,
- does not show deposits and withdrawals including dividends,
- does not show self‑financing capacity,
- does not show sustainable repayment.
This clearly means that Cash flow statement presents no indicators for assessing liquidity. The entrepreneurs and the members of supervisory board will not need this term.
The cash flow statement are discussed further in section on IFRS 18, alongside the income statement.